GEX Indicator: A No BS Gamma Exposure Guide
The GEX indicator measures the total dollar impact of options dealers' hedging activity on the underlying price. It's a quantitative tool that aggregates gamma exposure across all open options contracts to show you where market makers need to buy or sell to maintain delta neutrality.
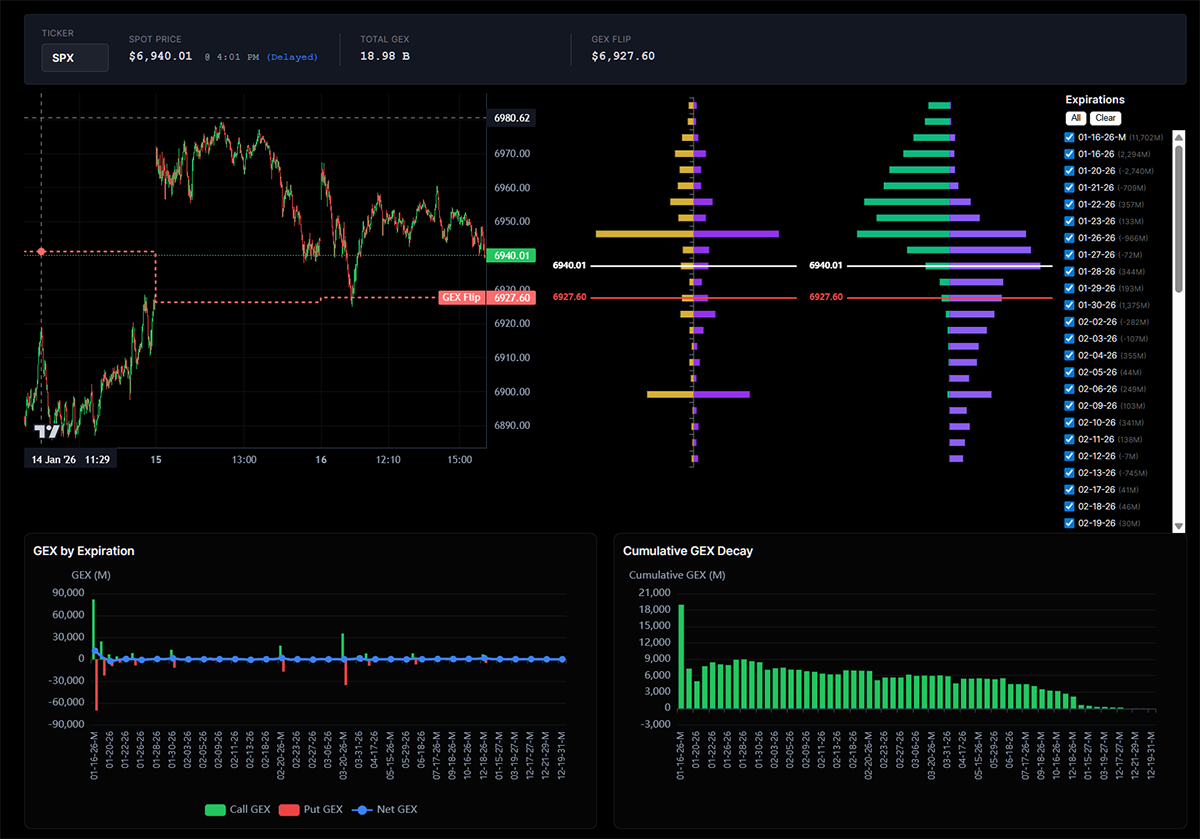
See it in action: Live GEX Dashboard
A GEX indicator plots this gamma exposure visually across strike prices and expiration dates. Instead of guessing where support and resistance might form, you see exactly where dealer positioning creates natural price barriers or accelerants.
Why does this matter for your trading strategy? GEX helps you:
Modigin focuses on clean, data-driven GEX analytics for US indices and liquid optionable stocks. The approach is simple: show traders the levels that actually influence market dynamics, and skip the noise.
No fancy overlays. No subscription tiers packed with features you'll never use. Just the gamma exposure data that experienced options traders need to make informed decisions.
Gamma measures how fast an option's delta changes when the underlying asset's price moves by one point. If gamma is 0.05, delta shifts by 0.05 for every $1 move in the underlying stock or index.
Gamma exposure GEX takes this concept and scales it across the entire options market. Here's how it works:
The calculation basics:
- Pull open interest data for every strike price across all expiration dates
- Calculate gamma for each options contract (calls and puts separately)
- Multiply gamma by open interest and the underlying price squared
- Net the call gamma against put gamma to get total gamma exposure
Market makers typically sit on the opposite side of retail and institutional options trades. When you buy call options, a dealer sells them to you. This creates a structural imbalance in their books that forces constant hedging activity.
How dealer hedging affects price:
| Dealer Position | Hedging Behavior | Price Effect |
|---|---|---|
| Net long gamma | Buy dips, sell rips | Stabilizing effect, lower volatility |
| Net short gamma | Chase price in same direction | Amplifies moves, increased volatility |
For major instruments like SPX, SPY, and QQQ, this hedging creates measurable impact. The surge in zero-days-to-expiration (0DTE) options—now over 40% of total SPX options volume—means gamma's market impact has never been stronger.
Key expirations to watch:
- Weekly Friday expirations (standard weeklies)
- Month-end/monthly OPEX
- Quarterly index rebalances
- VIX expiration dates
A "gamma regime" describes the overall sign and magnitude of net GEX across the market. This single metric tells you whether dealers are likely to dampen or amplify the next price movement.
Positive GEX Environment
When dealers hold net long gamma, they must:
This creates a stabilizing effect that compresses intraday ranges. Market volatility drops. Mean reversion strategies tend to outperform. Breakout trades get chopped up.
During calm stretches in late 2023, SPX frequently traded in positive GEX regimes. The index would grind higher with minimal pullbacks, frustrating traders looking for volatility. Price repeatedly pinned to gamma levels near major strikes.
Negative GEX Environment
When dealers are net short gamma, the dynamic flips:
This chase-the-move behavior accelerates trends. Tail risk increases. What starts as a normal pullback can snowball into something larger.
March 2020 showed negative gamma exposure at its extreme. As puts exploded in value, dealers scrambled to sell futures, amplifying the crash. The feedback loop between gamma hedging and price created historic market moves.
Regime can flip intraday around key levels. FOMC meetings, CPI releases, and major earnings clusters often trigger these shifts as options flow changes dealer positioning rapidly.
A practical GEX indicator converts raw gamma math into actionable price levels on your chart. These aren't arbitrary lines—they represent concentrated dealer positioning that influences actual market behavior.
Main Levels to Track
Call Resistance / Call Walls Zones with peak positive call GEX. When price approaches these levels, market makers who sold those calls must sell the underlying to stay hedged. This creates natural resistance.
Put Support / Put Walls Areas with concentrated negative put GEX. Dealers who sold puts must buy the underlying as price approaches, creating demand that often acts as support.
High Volatility Level (HVL) The price where net GEX flips from positive to negative. Above HVL, expect lower volatility. Below it, volatility typically expands.
How These Levels Appear on Charts
On SPX during mid-2024, the call wall sat near 5600 and repeatedly capped rallies until open interest rolled higher. The put wall around 5100 provided reliable support through multiple trading sessions.
Here's what you'd see on a clean GEX chart:
The best GEX charts don't look like a Christmas tree. They highlight 3-5 key levels that actually influence the trading day.
These three concepts form the backbone of how many traders actually use a GEX indicator day to day.
HVL / Gamma Flip / Zero Gamma
The High Volatility Level marks where net gamma changes sign. Think of it as a volatility watershed:
- Above HVL: Dealers are net long gamma. Expect mean reversion, tight ranges, and price often "pinned" to nearby strikes.
- Below HVL: Dealers flip to net short gamma. Moves accelerate. Breakdowns can cascade.
HVL often corresponds to a specific strike where cumulative GEX crosses zero. Watch it during market hours as the most important single level on your screen.
Call Walls
Call walls represent areas where heavy positive call gamma concentrates. Characteristics:
- Rallies stall or grind slowly through these zones
- Dealers supply liquidity by selling as price rises
- Breaks above often require OI to roll higher
- Most relevant near major round numbers (5000, 5500, etc.)
Put Walls
Put walls mark concentrated negative put gamma zones:
- Downside moves often pause here as dealers buy to hedge
- Bounces off put walls can be sharp (short squeezes)
- Breaks below can trigger accelerated selling
- These levels often coincide with market sentiment shifts
Example Scenario:
Price opens below HVL in negative gamma territory. It drops toward a major put wall at 5000. Two outcomes:
- Rejection: Dealers buy aggressively to hedge, creating demand. Price bounces. Net bearish positioning unwinds.
- Break: If selling overwhelms dealer buying, the put wall fails. Hedging flips to selling, accelerating the move lower.
This context matters more than the actual direction. GEX tells you why price is reacting, not just that it's reacting.
Modigin's GEX indicator strips away the noise that clutters most options analytics platforms. It's built for options traders who want institutional-grade data without the marketing fluff.
What You Get
| Output | Description |
|---|---|
| Net GEX Curve | Total gamma exposure across all strikes, updated throughout the trading session |
| Call/Put GEX Breakdown | Separate views to understand directional positioning |
| HVL Level | Clear marking of the gamma flip point |
| Call Wall Zones | Primary resistance levels from concentrated call gamma |
| Put Wall Zones | Primary support levels from put gamma concentration |
| Regime Label | Simple indicator showing positive or negative gamma environment |
Data Quality
Modigin uses institutional-grade options data with intraday updates every few minutes. This isn't tick-by-tick (no GEX tool realistically is—open interest data has inherent lag), but it's frequent enough for real-time gex analysis during active market hours.
The calculations are transparent. You can see how levels are derived, not just trust a black box.
Coverage Universe
- S&P 500 index (SPX) and components
- Top 100+ US ETFs (SPY, QQQ, IWM, etc.)
- High-liquidity single names (AAPL, TSLA, NVDA, AMZN, etc.)
If it has active options flow, Modigin likely covers it. The focus stays on instruments where GEX actually moves price—not thinly traded underlyings where the data becomes noise.
What Modigin Doesn't Do
- Gamify charts with unnecessary animations
- Stack 47 indicators on one screen
- Hide the actual data behind "proprietary" buzzwords
- Promise that GEX is a magic signal generator
The tool shows gex levels. Your job is to interpret them in context.
This is where GEX moves from interesting concept to practical edge. Here's how to integrate it into intraday and swing strategies.
Intraday Trading Applications
Trading Around HVL:
- Start each trading day by noting where HVL sits relative to overnight price
- Price above HVL = fade extremes, expect mean reversion
- Price below HVL = respect momentum, expect extended moves
Working with Gamma Walls: In positive GEX regimes, large call walls often cap rallies intraday. Look for shorts near these levels with tight stops above. Put walls offer similar logic for longs.
Respecting Breakouts: When gamma flips negative below HVL, breakouts are more likely to follow through. Traders typically adjust from fading moves to trading continuations.
Swing Trading Applications
Pullback Analysis: Use historical GEX to gauge whether pullbacks are likely contained by large put supports. If a substantial put wall sits below current price with positive GEX above, shallow dips are more probable.
Downside Risk Assessment: When put walls are thin relative to current positioning, downside risk may be under-hedged. This context helps with position sizing on swing longs.
Combining GEX with Other Metrics
GEX works best alongside basics, not as a replacement:
- Price action: GEX provides context; price confirms direction
- Volume: High volume through a gamma wall means more than low-volume drift
- Moving averages: Trend context helps filter GEX signals
- IV rank: Implied volatility context shows if options are cheap or expensive relative to history
Don't build a Frankenstein chart. Keep the setup clean with GEX levels, a volume indicator, and maybe one trend filter.
Risk Management
GEX is a context tool, not a signal generator.
It tells you where dealers are positioned and how they're likely to hedge. It doesn't tell you exactly when to enter or what your stop should be.
Position sizing discipline and stop-loss rules remain essential. A professional trader uses GEX to improve trade selection, not to abandon risk management fundamentals.
The trade-off between real-time responsiveness and data stability matters for how you use GEX.
Real-Time / Intraday Updates
As market participants trade options throughout the session, open interest and the underlying price shift. This means:
- HVL can move during the trading day
- Wall levels adjust as new positions open
- Gamma regime can flip on high-volume days
Real-time GEX is essential for 0DTE scalping and intraday positioning. On a volatile CPI release day, watching HVL shift in real time tells you whether the market is transitioning from calm to chaotic.
End-of-Day / Snapshot Views
For swing analysis and backtesting, end-of-day snapshots provide cleaner data:
- Settled open interest (no intraday noise)
- Clear comparison across days
- Better for understanding structural positioning over weeks
How Modigin Handles Both
The live dashboard updates throughout market open to market close for intraday traders. Historical panels store daily snapshots for research and strategy design.
Intraday use case: You're monitoring SPX on FOMC day. The morning session shows HVL at 5200. As the announcement hits, options flow shifts dramatically. HVL drops to 5150. This real-time information tells you volatility regime just shifted—adjust accordingly.
Multi-week analysis: You pull 20 days of historical GEX data to understand how the market behaved around a series of put walls. This backtesting reveals patterns you can incorporate into your overall market positioning approach.
For readers who want to go beyond basic walls and flips, here's how to deepen your GEX analysis.
Net GEX
Net GEX represents total call gamma minus total put gamma, converted to dollar terms. The formula:
- Positive net GEX = Dealers net long gamma overall
- Negative net GEX = Dealers net short gamma overall
- Magnitude matters: $200B aggregate exposure hits differently than $50B
Example: On a peak SPX 0DTE day, total volume might push net GEX above $100B positive. That's massive stabilizing force. Compare that to a thin holiday session where net GEX barely registers.
GEX Ratio
A GEX ratio expresses the share of positive gamma versus total volume:
- Above 0.5 = More call gamma than put gamma (bullish positioning implication)
- Below 0.5 = Put gamma dominates (net bearish positioning implication)
This compact metric summarizes regime strength in a single number. It's useful for quick dashboard checks without diving into full curve analysis.
Flow Context
GEX concentration alone doesn't tell the whole story. Layering in options flow metrics reveals whether gamma is building from actual sentiment or just rolling noise:
- High volume at a strike + growing OI = Real positioning
- High volume with shrinking OI = Closing activity, gamma dissipating
- Delta exposure trends show directional bias beyond pure gamma
This flow context helps distinguish noise from high-conviction dealer positioning that's likely to influence market moves.
Past GEX behavior validates how useful the indicator really is. Here are two contrasting examples.
Case Study 1: High-GEX Calm (Late 2023)
During the November-December 2023 rally, SPX frequently traded in deeply positive GEX territory:
- HVL sat well below market price
- Large call walls formed at round numbers (4800, 4900, 5000)
- Price pinned to strikes 80% of trading sessions
- Realized volatility dropped despite headlines
What you'd see on the Modigin indicator:
- Net GEX consistently positive
- HVL level marked far below price
- Call wall zones capping each push higher until OI rolled forward
Traders who faded rips into call walls profited. Breakout traders got chopped up.
Case Study 2: Negative-GEX Volatility (March 2020)
The COVID crash showed negative gamma exposure at extreme levels:
- Massive put buying flipped dealers to net short gamma
- HVL jumped above price as gamma flipped
- Put walls failed as selling overwhelmed dealer buying
- Daily swings exceeded 10% as hedging amplified moves
The GEX indicator would have shown:
- Deeply negative net GEX
- HVL above market price (volatility regime)
- Put walls breaking rather than holding
- Gamma flip levels shifting dramatically day to day
What These Cases Reveal
GEX doesn't predict direction. It reveals the character of likely moves:
| Regime | Expected Behavior | Strategy Implication |
|---|---|---|
| High positive GEX | Grinding, pinned, low volatility | Fade extremes, sell premium |
| Negative GEX | Sharp moves, breakouts follow through | Trade momentum, manage size |
This is why historical analysis matters. Seeing how price respected or broke through GEX levels builds intuition for real-time application.

Staying true to the "No BS" approach: GEX is powerful but not magic.
Data Timing Realities
Open interest and greeks update on a schedule, not tick by tick. When you trade 0DTE options, the fills happening right now don't instantly change accurate GEX readings. There's inherent lag in any GEX data.
- Exchange-reported OI updates have delay
- Gamma calculations use snapshot data
- Intraday estimates are approximations
Not Guaranteed Turning Points
Treating GEX levels as guaranteed support/resistance is a mistake. They're probability zones, not lines in the sand.
A call wall at 5500 doesn't mean price can't go higher. It means dealers will sell into rallies there, creating headwind. Strong enough buying overpowers that headwind.
Expiration Effects
GEX can change drastically around:
- Monthly OPEX (third Friday)
- Quarterly index rolls
- VIX expiration
- Major earnings after options expiration
The Monday after monthly OPEX often looks completely different from the Friday before. Positions expire, gamma disappears, and new positioning reshapes levels.
Context, Not Triggers
GEX tells you where market dynamics will likely shift. It doesn't tell you when to click buy or sell.
Use GEX as context:
- Adjust position sizing based on regime
- Set stops with awareness of nearby walls
- Understand why price is behaving a certain way
Don't use GEX as:
- A standalone entry signal
- A guarantee of reversal
- A replacement for risk management
Test it on your own timeframes before sizing up. What works for SPX 0DTE scalping might not apply to AAPL swing trades.
If you're familiar with options trading and want to add dealer positioning context to your workflow, here's how to start.
Onboarding Steps
- Create your account – Sign up at Modigin and access the dashboard
- Select your tickers – Start with SPX, SPY, or QQQ for the clearest GEX data
- Open the GEX dashboard – View net GEX, HVL, and wall levels
- Load levels on a chart – See where gamma concentrates relative to current price
Quick Start Setups
Intraday Index Monitoring: Track SPX or SPY GEX throughout the trading session. Note HVL at market open and watch for shifts. Use call/put walls as reference for entries and exits.
0DTE Scalping Context: Focus on same-day expiration gamma concentration. Identify which strikes have the most GEX concentration and use them as intraday targets or stop zones.
Swing Positioning Checks: Review multi-day GEX trends before entering swing positions. Understand whether current levels provide cushion or if downside risk is under-hedged.
What to Expect
Modigin delivers:
- Clean interface without chart clutter
- Transparent data showing how levels are calculated
- No marketing fluff or gamification
- The gamma levels and gex data traders actually use
What you bring:
- Options knowledge and market experience
- Risk management discipline
- Willingness to backtest before sizing up
Start Trading with Context
GEX doesn't replace your trading plan. It enhances it by revealing where option dealers need to hedge and how that hedging influences market positioning.
The actual sentiment of the options market becomes visible. Overall market positioning shifts from guesswork to data.
Try Modigin's GEX analytics and integrate them into your existing workflow. Start with major indices where the signal is cleanest, then expand to single names as you build confidence in reading the levels.
No BS. Just data. That's the point.