Free Options Profit Calculator With Real-Time Greeks
Modgin’s options calculator lets traders input a real stock or index—such as AAPL, SPY, or SPX—and instantly see theoretical option prices and Greeks based on the Black-Scholes model. Whether you’re exploring a call or put option on your favorite underlying stock, the tool delivers fair value prices and sensitivity metrics in seconds.
The calculator updates values using the latest available underlying price from the market session. Depending on your data source, this could be the last closing price or a live feed, ensuring your analysis reflects current market conditions.
Key inputs you can adjust:
- Option type (call/put)
- Strike price
- Expiration date or exact days to expiration (DTE)
- Implied volatility
- Risk-free rate
- Dividend yield
Seeing how option pricing reacts when you change these input parameters is crucial for understanding how options really work and for avoiding common beginner mistakes.
The form layout is straightforward: select your option type, enter the ticker, set your strike and DTE, and adjust IV as needed. The results panel displays the theoretical price and all Greeks in a clean table, giving you everything you need at a glance.
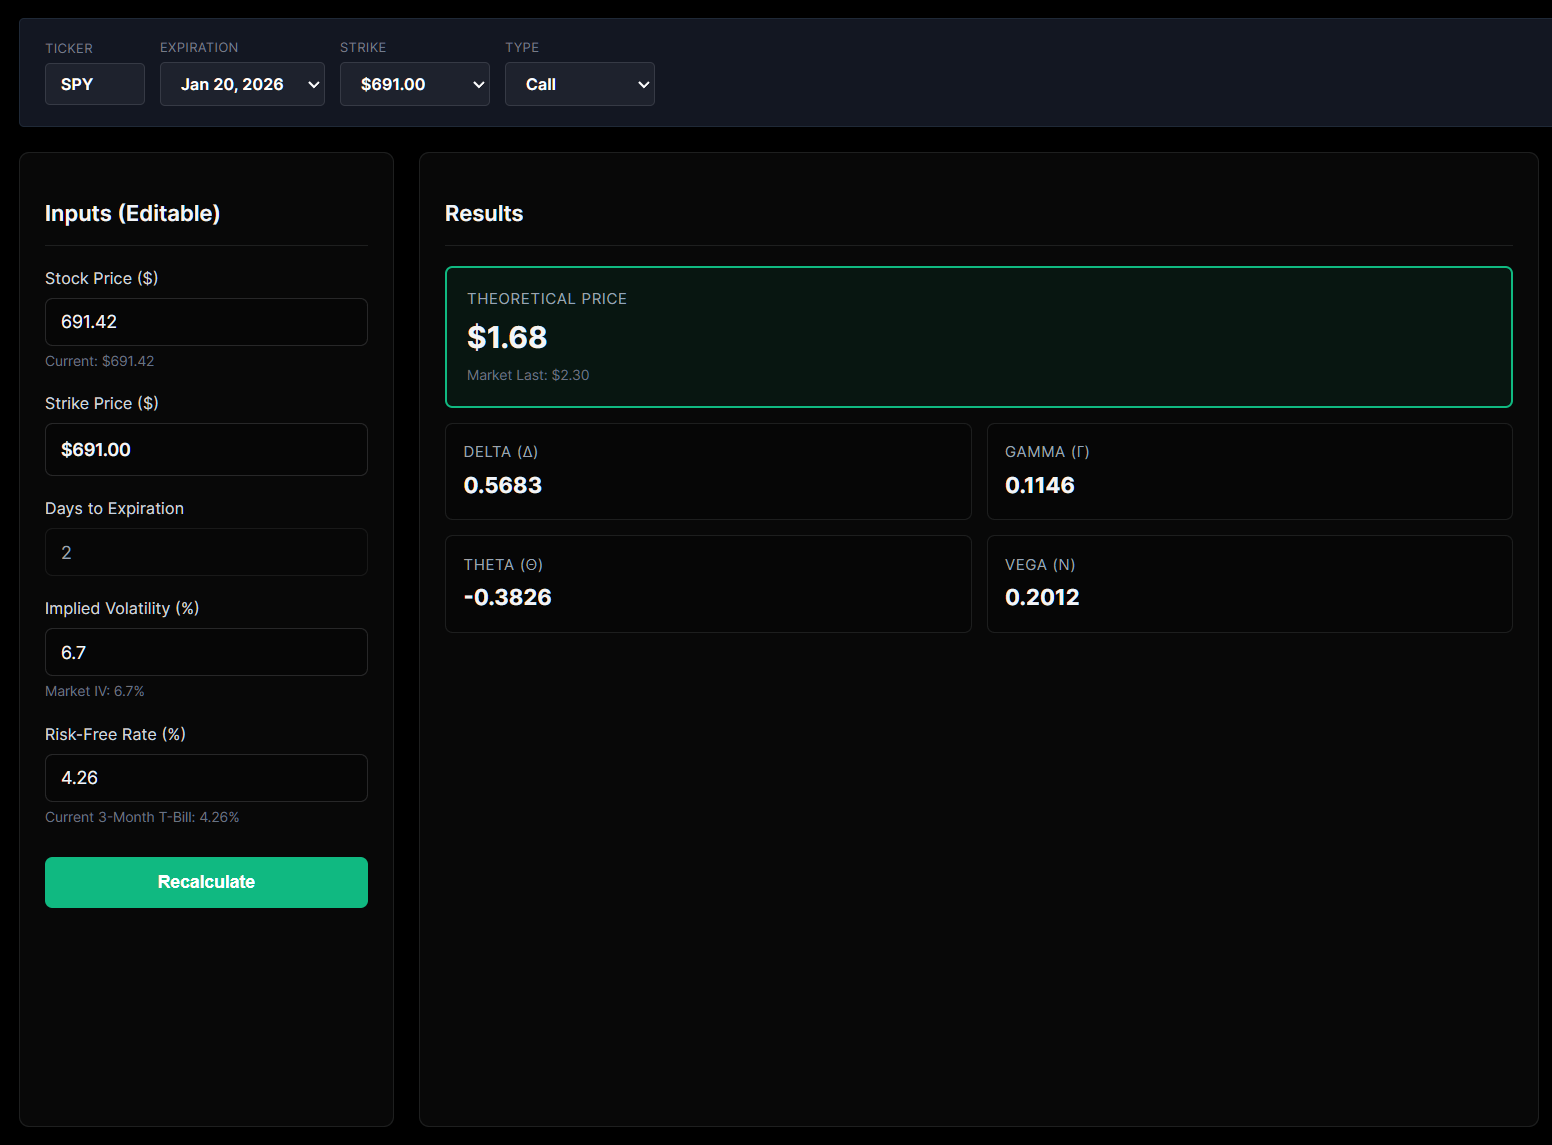
Modgin uses its own implementation of the classic Black-Scholes model—not Black-76 or binomial trees—to compute fair values and Greeks for equity and index options. This approach provides traders with a transparent, consistent framework for understanding option price dynamics.
In non-technical terms, Black-Scholes takes the current stock price, strike price, time to expiration, volatility, interest rates, and dividends to estimate a "fair" theoretical option price. The model essentially answers the question: what should this contract cost given current market conditions?
How each input feeds the model:
- Current price of the underlying determines intrinsic value
- Strike sets the exercise threshold
- Time to expiration contributes to time value through the square-root relationship
- Implied volatility reflects expected price swings
- Risk-free rate discounts future payoffs
- Dividend yield adjusts for expected cash distributions
Model assumptions to keep in mind: Black-Scholes assumes continuous trading, log-normal price distribution, and constant volatility throughout the option's life. Modgin exposes these assumptions through editable fields so users can experiment and understand their impact.
The calculator computes Greeks (Delta, Gamma, Theta, Vega, Rho) by analytically differentiating the Black-Scholes formula. This provides fast, consistent output for every contract without the computational overhead of Monte Carlo simulations.
This section walks through every input on the calculator form and how each one should be presented, using concrete examples based on a stock like AAPL in 2026.
Underlying Price
The underlying price field auto-fills from the latest quote—for example, AAPL at $210.35 on 17 January 2026. However, you can override this manually to run "what-if" scenarios, such as testing how the option would behave if the current stock price jumped to $230 after earnings.
Option Type and Style
Radio buttons or a dropdown let you choose "Call" or "Put" to specify the option type. Modgin currently prices European-style exercise using Black-Scholes but can approximate U.S. options that are not deeply in-the-money with significant dividends. For most equity options trading scenarios, this approximation works well.
Strike Price
A numeric input accepts your target strike price. For AAPL in early 2026, example ranges might span from $150 to $280. Choosing strikes above the current price helps visualize out-of-the-money (OTM) call behavior, while strikes below show in-the-money (ITM) dynamics.
Expiration / Days to Expiration (DTE)
A calendar picker lets you select the expiration date, with a read-only field automatically converting that date into actual calendar days to expiration. For instance, selecting a February 2026 expiration might show 30 DTE, while a May contract shows 120 DTE. This conversion feeds directly into the Black-Scholes formula.
Implied Volatility (IV)
A slider and input box accept IV values from 5% to 150%. You can either:
Risk-Free Rate
This input comes pre-filled with a relevant government yield—such as the U.S. 3-month T-bill rate in early 2026—but remains editable for scenario testing. If you want to model a Fed rate cut or hike, simply adjust this field.
Dividend Yield
Enter the annualized dividend yield for the underlying stock. For a company like AAPL in 2026, this might be approximately 0.60%. The model uses this to adjust for expected payouts before expiration, which affects call options more significantly than puts.
Layout note: The form displays vertically with clear labels. Tooltips explain each field in one sentence, and default values reflect realistic 2026 market conditions to get you started quickly.
The results panel splits into two main blocks: theoretical value (showing both call and put prices) and the Greeks, each displayed in a compact table format.
Theoretical Option Price
The calculator shows the fair value for your selected contract. If you enter a market price from your broker, the tool displays the difference, indicating whether the option appears over or undervalued relative to the model. This compare function helps traders spot potential opportunities.
Greeks Explained
| Metric | What It Measures | Example Value |
| Delta | How much the option price moves per $1 change in underlying | Call: 0.55, Put: -0.45 |
| Gamma | How quickly delta changes as the underlying moves | 0.025 |
| Theta | Daily time decay (premium lost per day) | -$0.06 per day |
| Vega | Price change per 1% move in implied volatility | +$0.12 |
| Rho | Price change per 1% move in interest rates | +$0.03 |
Delta: Displayed for both calls and puts, delta measures how much the option price should move if the underlying moves by $1. A delta of 0.55 means your call gains approximately $0.55 when the stock rises $1.
Gamma: Shows how quickly delta itself changes. High gamma near expiration means more sensitivity—your delta can shift dramatically with small price moves in the underlying stock.
Theta: Shown as daily time decay, this is crucial for understanding how quickly options lose value as days pass. A theta of -$0.06 means the option loses about six cents per day, all else equal. This affects decisions about trading options with short expirations.
Vega: Reports how much the option price is expected to change for a 1 percentage point move in implied volatility. If vega is +$0.12, a jump from 25% to 26% IV adds twelve cents to your premium.
Rho: Displayed but visually de-emphasized for short-dated equity options where interest-rate sensitivity is smaller. Rho becomes more relevant for long-dated LEAPS where rate changes have months or years to compound.
Units note: All values are displayed per share. Multiply by 100 for per-contract figures on standard equity options.
From Modgin's perspective, actually moving the sliders and changing inputs teaches traders how pricing behaves far better than reading formulas alone. The practice of hands-on exploration builds intuition that no textbook can replicate.
Exploring questions like "what happens if IV jumps 10%?" or "what if the Fed cuts rates in mid-2026?" directly in the calculator helps you understand risk before committing money to a trade. This analysis capability is essential for anyone serious about options trading.
Modgin's Black-Scholes implementation is deterministic and transparent: for the same inputs, you always get the same theoretical value. This accuracy makes it ideal for back-testing rules, comparing strategies, and building educational foundations. The calculation process is consistent every time.
Modgin's goal is not to replace a full trading platform but to be the cleanest, fastest way to understand fair value versus market price for single-leg options. Before you layer on spreads, condors, and butterflies, you need to understand how a single option behaves.
Repeatedly using the calculator on real tickers like SPX, QQQ, or TSLA across turbulent periods in 2025-2026 helps you see how volatility and time drive most of the option's price. This world experience is invaluable.
Habits to adopt:
- Always check theoretical value before entering any options trade
- Inspect theta before buying weekly options to understand your daily cost
- Compare vega across different expirations to understand volatility exposure
- Test extreme scenarios (IV doubling, stock dropping 20%) to see worst-case outcomes
- Use the calculator after market close to analyze the day's price movements

This section provides concrete use cases for the tool, using real-world style examples. Rather than step-by-step math, focus on what to observe in the UI and what insights to gain.
Buying a Long Call Before Earnings
Many traders purchase call options ahead of earnings announcements, hoping for a profitable move.
- Select a high-volatility stock with an earnings date in Q1 2026
- Raise IV to 50-60% to reflect event risk (compared to typical 25-30%)
- Choose a strike slightly OTM and 2-3 weeks to expiration
- Observe: How dramatically the call price and vega increase with elevated IV
- Learn: Why options are expensive before earnings and how IV crush affects post-announcement value
Protective Puts for a Portfolio
Hedging downside risk is a common application for put options.
- Enter the current price of an index ETF like SPY in mid-2026
- Choose a slightly OTM put (3-5% below current price)
- Set DTE to 60-90 days for reasonable time value
- Observe: Delta tells you how much protection you gain per dollar of market drop
- Learn: The cost of insurance via the theoretical value and how theta erodes that protection daily
Weekly Options and Time Decay
Short-term options experience aggressive theta decay.
- Select any liquid stock and an expiration 7 days away
- Note the theta value (it will be significantly negative)
- Change expiration to 60 days out, keeping everything else constant
- Observe: How theta is much smaller for the longer-dated contract
- Learn: Why selling weekly options attracts premium sellers and why buyers face an uphill battle against time
LEAPs vs Short-Term Options
Long-dated options behave very differently than their short-term counterparts.
- Pick a 1-year LEAP (365 DTE) on a stock like AAPL
- Also price a 30-day contract on the same strike and underlying
- Observe: Vega is substantially higher for the LEAP; rho becomes meaningful
- Learn: Why long-dated options are more sensitive to changes in volatility and interest rates—critical in 2026's rate environment
Moneyness Experiments
Understanding how moneyness affects pricing is fundamental.
- Fix DTE at 45 days and IV at 30%
- Scan strikes from deep in-the-money to far out-of-the-money
- Observe: How price, delta, and gamma change in the output table
- Learn: Deep ITM options have delta near 1.0 and mostly intrinsic value; far OTM options are all time value with low delta and high gamma sensitivity
While Black-Scholes typically gives a fair value from a known IV, traders in practice often know the market option price and want to infer the implied volatility behind that premium. This reverse approach is how professional traders think about volatility.
Modgin's options calculator can generate fair value in the standard direction, but it can also be extended to a "solve for IV" mode. In this mode, you input the observed market premium, and the engine iteratively adjusts IV until the theoretical price matches that premium.
This reverse-solved IV is what traders quote when they say "this option is trading at 40% implied." It allows you to compare volatility levels across different expirations and strikes on the same underlying stock, revealing the volatility surface.
Why this matters in 2025-2026: Elevated macro uncertainty—rate decisions, geopolitical events, elections—often shows up first in changing implied volatilities before the underlying makes large moves. Tracking IV gives you early warning signals.
This section provides a factual comparison while clarifying Modgin's specific focus relative to other tools in the market.
Some platforms use binomial trees or Black-76 models, particularly for futures contracts and interest-rate options. Modgin's calculator specifically uses the Black-Scholes framework tailored to equities and equity indices, providing such information in a focused, accessible way.
CME-style calculators may offer multiple models for options on futures, handling the nuances of commodity and rate derivatives. Modgin prioritizes a single, transparent Black-Scholes implementation that users can learn and trust without switching between models.
Portfolio-oriented options profit calculator tools often focus on profit and loss at expiration for complex strategies. Modgin instead focuses on understanding single-option fair value and Greeks in real time as a foundation. This is not investment advice—it's education.
| Feature | Modgin | CME-Style | Portfolio Tools |
|---|---|---|---|
| Model Choice | Black-Scholes only | Binomial, Black-76, etc. | Various |
| Asset Focus | Equities and equity indices | Futures, rates, commodities | Multi-asset |
| Complexity Level | Single-leg foundation | Professional-grade | Multi-leg strategies |
| Educational Clarity | High (transparent inputs/outputs) | Variable | Strategy-focused |
This foundational understanding is essential before layering on spreads, condors, and other multi-leg structures. Modgin's calculator is intended as that first, rigorous step—without commission fees or platform complexity getting in the way.

Here's a concrete onboarding path for a new user: open the calculator, pick a liquid stock or index, and run a first pricing example within a minute. No stock purchase required—just exploration.
Step 1: Choose Your Underlying
Select a well-known ticker like SPY or AAPL. Confirm that the current price matches recent market data or your broker's quote. This ensures your analysis starts from accurate data.
Step 2: Set Your Contract Parameters
Select call or put, pick a realistic strike (near the money is good for learning), and choose an expiration 30-60 days out. Leave the default IV, risk-free rate, and dividend yield as suggested by Modgin for your first run.
Step 3: Observe the Results
Look at the theoretical price and Greeks. Then change one variable at a time—first IV, then DTE, then strike—and watch how the numbers react. This practice builds intuition faster than any page of theory.
Step 4: Compare to Market
Pull up the live option premium from your broker for the same contract. Enter it into Modgin's tool to see whether the market price is rich or cheap relative to the model. Determine if there's a gain opportunity.
Step 5: Repeat and Explore
Run this exercise on multiple underlyings and market conditions—calm weeks versus major data releases or volume spikes. Track how pricing dynamics change over time. Customize your scenarios based on what you want to learn.
The buyer of any option—whether speculative or protective—benefits from understanding exactly how that contract is priced. Options expire worthless more often than not, and understanding why helps you make profitable decisions.
Never trade options without understanding how they are priced. The few minutes spent with a calculator today can save you from costly mistakes when real money is on the line.
- Modgin's options calculator uses the Black-Scholes model to calculate theoretical values and Greeks for equity options
- Every input—from strike to IV to dividend yield—has a direct, quantifiable effect on the option price
- Greeks like delta, theta, and vega help you understand directional exposure, time decay, and volatility sensitivity
- Reverse-solving for implied volatility reveals how the market is pricing uncertainty
- Hands-on practice with the calculator builds intuition that theory alone cannot provide
- Understanding single-option pricing is the essential foundation before exploring multi-leg strategies
Start using Modgin's options calculator today. Pick a ticker you know, adjust the inputs, and watch how option pricing comes alive. The insights you'll gain will transform how you approach every options trade.